
Tool Overview
The Prairie Water project has gathered a significant amount of data relevant to water and land-use management on the Canadian Prairies. The Visforce dashboard aims to make the knowledge generated by our research accessible and vizualisable.
The dashboard allows users to visualise data, including watershed classification, spatial data, and modelled changes in water resources, through a map interface as well as a plot interface. The tool also allows users to download desired datasets.
Stay tuned for a live version of this tool.
Data Sources
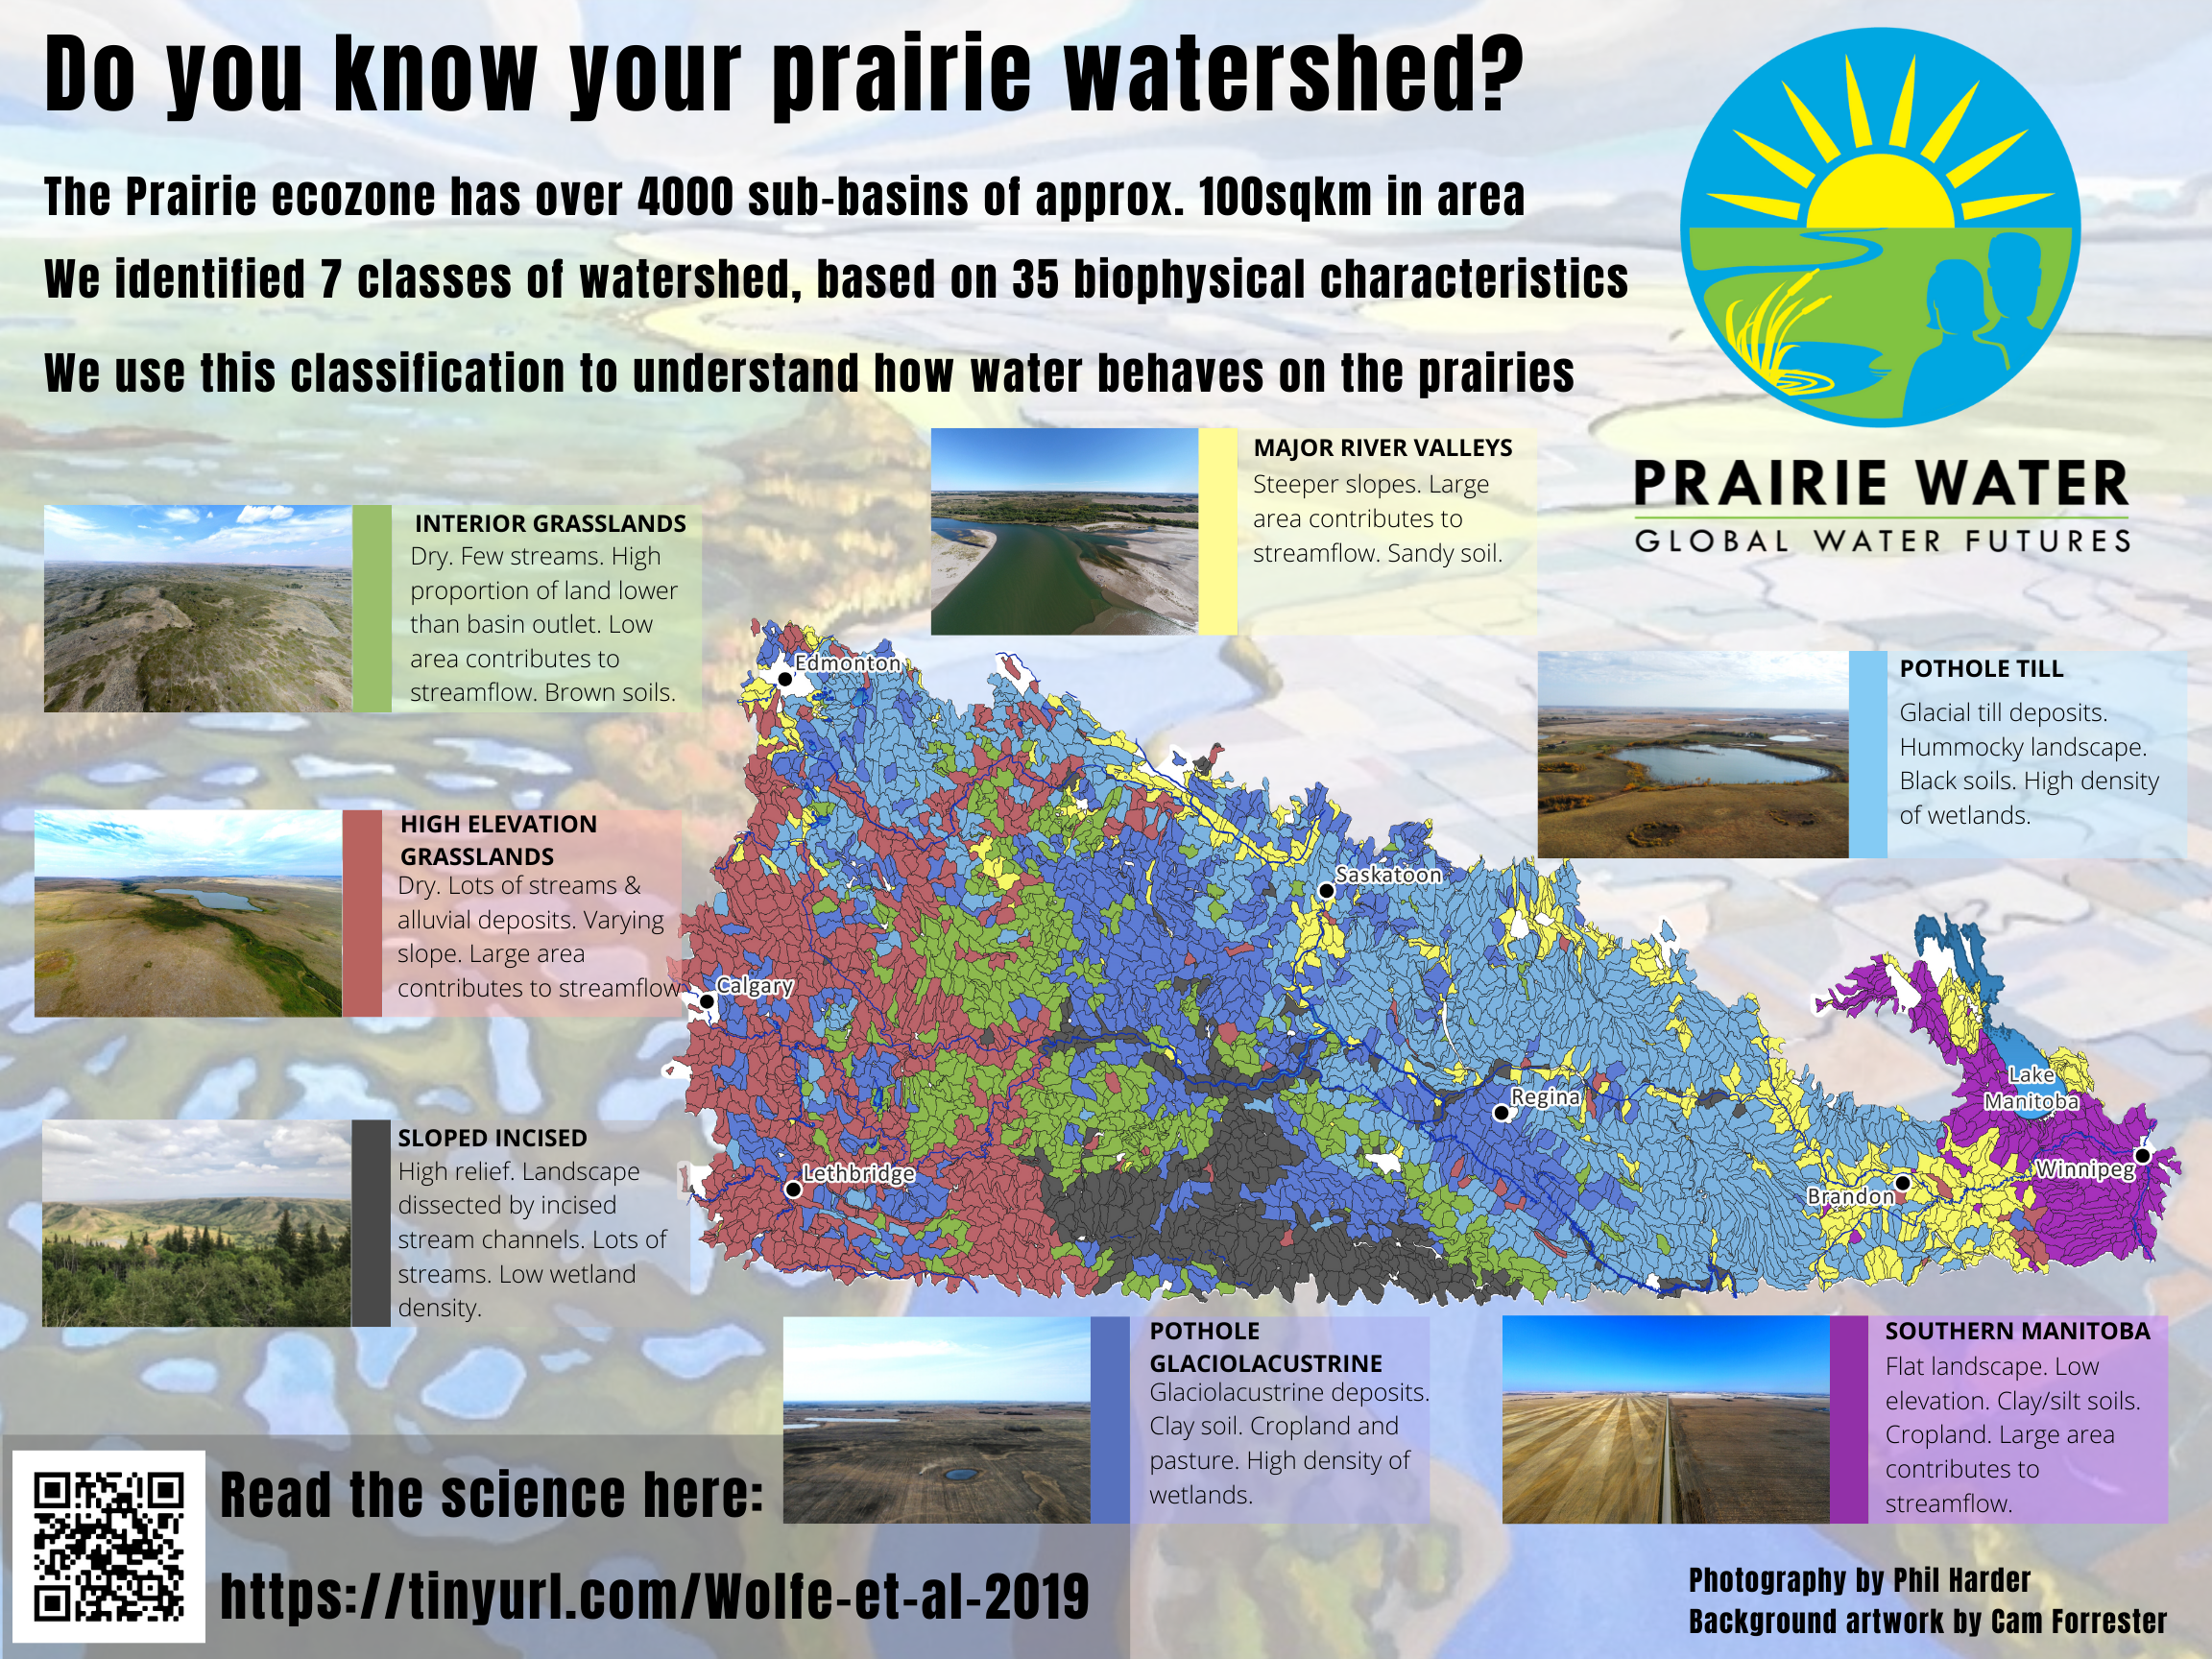
Watershed classification was conducted using a hierarchical clustering of principal components based on climate, geological, topographical, and land-cover data from the Prairies. Seven basin classes were delineated. See image below for an overview of basin class geography.
For further information, see 5194/hess-23-3945-2019
Pesticide data
The below parameters were calculated for each of the major pesticide groups (herbicides, fungicides, insecticides) in the Canadian Prairie Pothole Region.
- The Pesticide Use Density (PUD, kg/km2) indicates the mass of each major pesticide group applied per km2 grid cell over the course of a year.
- The Wetland Pesticide Occurrence Index (WPOI) indicates the likelihood of pesticide transport and occurrence in wetlands. This value is normalized and ranges from 0 to 1.
Groundwater recharge data
The spatial distribution of the average groundwater recharge rates was simulated in central and southern Alberta. To identify how agricultural land use influences recharge, two different sets of soil and vegetation parameters were used as input for the simulation.
- Grassland: Parameters used represent perennial grass for cattle grazing.
- Cropland: Parameters used represent cropland under annual crop rotation.
Watershed Sensitivity Data
Sensitivity to environmental forcings was assessed for each of the seven basin classes (see Watershed classification). Model simulations were forced by multiple scenarios characterized by differing precipitation, temperature, and wetland drainage. Daily basinflow and soil moisture, and yearly peak snow water equivalent and peak flow are summarized for 40+ year model simulations. Basin specific forcing data was not used, meaning that all basins in the same watershed class have the same time-series.
For further information, see 5194/hess-26-1801-2022 and 10.5194/hess-26-5555-2022
PHYDAP Data
Using the virtual basin modelling framework, the Prairie HYdrology Design and Analysis Product (PHYDAP) data provides vertical hydrological fluxes for all (4175) classified watersheds using local climate (historical and future). The characteristics of the classes (see Watershed classification), and long term gridded climate data were used to simulate daily evaporation, rainfall, runoff, and snowmelt (mm) for each watershed over the course of almost 40 years.
For further information, see Prairie Hydrology Design and Analysis Product