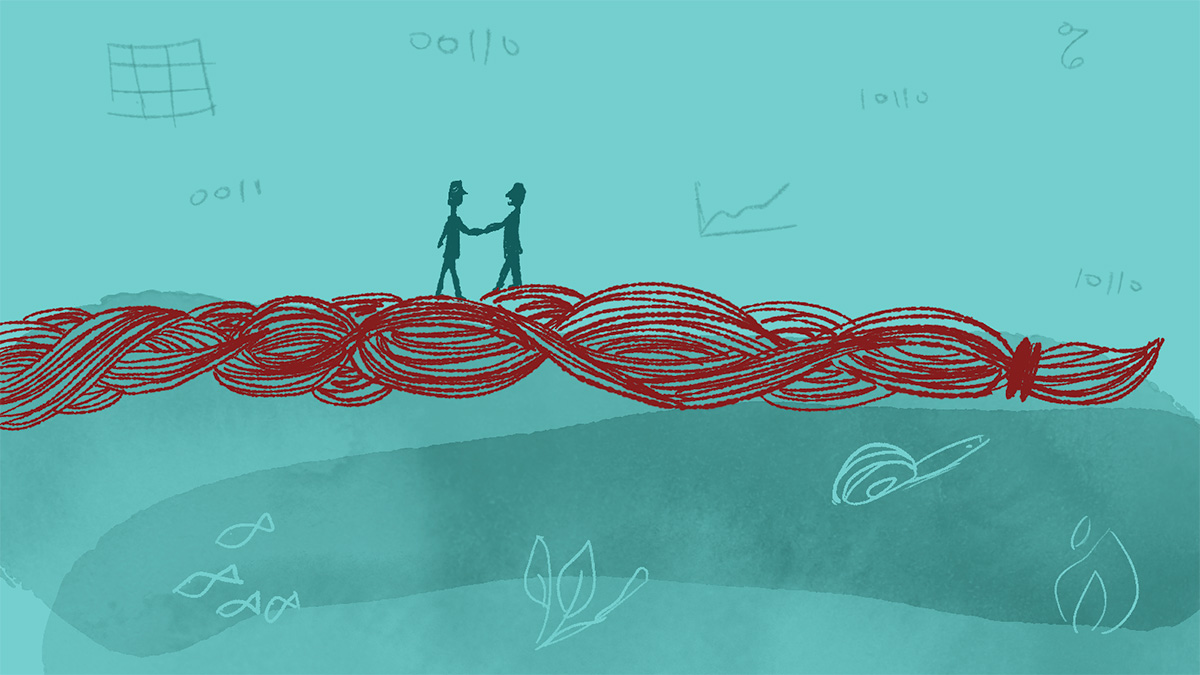
Braiding Knowledge Systems
Learning the value of what we don’t know
Tricia Stadnyk
Associate Professor Tier II Canada Research Chair in Hydrologic Modelling, Department of Geography, University of Calgary
Part of the joy and threat of being a modeller is that you don't typically have to interact directly with anyone other than a computer screen. The introvert in me loves this about my job. On the other hand, it becomes difficult to connect your work with the human, natural and real-life impacts of the predictions we make. There is value in realizing what we don't know, or what we can't predict with the models; in realizing the value of the knowledge we miss when we focus solely on the technical. This is a story of braiding western science with traditional knowledge to increase ways of knowing.
Traditional Knowledge cannot be found in transcripts or books, it is a visual and oral history recounting the intertwined relationship of the evolution of the land and its people. It is a story that places people below the importance or significance of the land, that emphasizes we are dependent on the health of the land and its gifts. In Western Science, such qualitative knowledge is oft disregarded as not useable or insignificant to complex technical problems requiring computer-based models and solutions.
In a project that looked at water history in a western Canada First Nations community, we wanted to find a way to treat both knowledge systems as equal, and to raise the integrity of both the Western Science and traditional story-based knowledge. The challenge we were faced with was to find a common language to integrate our different ways of knowing and knowledge systems. This is when we turned to maps.
In Western Science, maps are a spatial integration of place and time information, facilitating big picture thinking of a series of interconnected systems. For hydrologists, they are valuable tools to represent the sensitivity or influence of changes in one part of the network on others. In First Nations culture, maps were similarly visual representations of community interactions and places explored, connecting people to their land. The idea was to present the community leaders and elders with maps of their community and the lands surrounding the community –with emphasis on water features – using them as catalysts for sharing stories about the changing landscape.
I can still remember the quiet of the dark room at the back of a casino where we met. It was awkwardly quiet, and the room was heavy with uncertainty of this meeting. We would first present an update on our research – highly technical computer-based modelling of the community, presenting different flood inundation scenarios. The first question: "What exactly is a model?" completely unnerved me. How do I explain what a model is and what it does to an Elder who has never used a computer? My answer, "A series of mathematical equations that interact" did not seem to sit well. Second big gulp. Try again. "Well – what we really need to know is where it floods and when…". Silence. More silence. And then … the Chief leaned back in his chair, clapped his hands and said "Well why didn't you just say that?!" I had found the bridge – the link between the information we as modellers needed to prove our model was working well, and the information the community valued and was open to sharing. The next meeting we came armed and ready with large 2D paper maps. We began the meeting by rolling them open along tables shoved together. The lights were turned on and the curiosity of the Chief and Elders was immediately piqued. They sauntered over and asked "So what's this about, eh?"
Though fancy computer-generated slides had been prepared for that second meeting, they were not where we spent the bulk of our time. Instead, as a small group we pored over the maps and listened to the stories the Elders had to tell. "Here – my father used to hunt and trap here 50 years ago. But no more. It's now a lake (pointing to the middle of a lake feature indicated on our map)".
We heard story after story, linking the place and time of water on the landscape and how the land was used. Memories of where teepees were erected for a ceremony in a given year, which was particularly significant due to the fact this was a notorious ceremonial site that was only useable in this one year – a relative drought period.
Back in our office behind our computers, students translated these memories that were hand-written on sticky notes and stuck to our maps into validation data, running the model and plotting the flood extents – looking for high and low water periods in specific places and time periods connected to the traditional stories that had been shared. Eventually these stories would be translated into a live ArcGIS StoryMap® with an accompanying survey that the community members could interact with. As the stories were entered, our team of modellers used the information shared to check the model and increase our confidence that it was representing the flooding on the landscape accurately. This in turn has made our model better.
What we didn't expect on the onset of this project was the benefit to the community. After generations of being told their stories were fiction and not of scientific value, they were suddenly being heard and their knowledge was having a demonstrable influence on the science that westerners rely on. It was now visible to policy makers and influencers. By opening ourselves up to different ways of knowing, we not only gained a unique dataset that increased our confidence in the model's predictions, but we offered a community reconciliation by bearing witness to the value added to science by their Traditional Knowledge.
Find out more about how water research can support Indigenous communities:
Blais, E. L., Greshuk, J., & Stadnyk, T. (2016). The 2011 flood event in the Assiniboine River Basin: causes, assessment and damages. Canadian Water Resources Journal/Revue canadienne des ressources hydriques, 41(1-2), 74-84.