
GWF-WRF
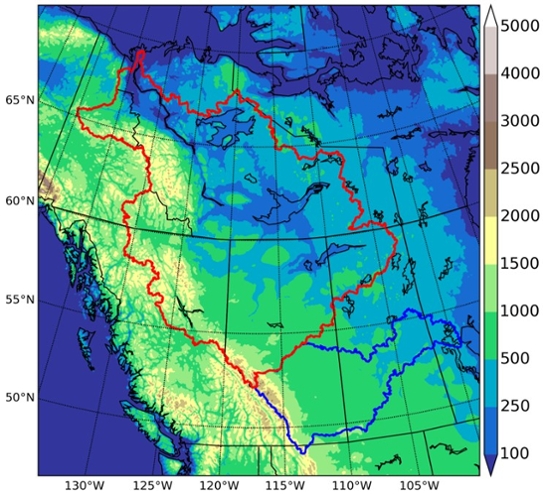
The Weather Research and Forecasting (WRF) model Version 3.6.1 was used to simulate the historical (2000-2015) and projected climate (RCP8.5) over western Canada with a convection-permitting resolution of 4 km. The WRF model is fully compressible and nonhydrostatic and uses the Advanced Research WRF dynamical solvers. The model domain is composed of 699 x 639 grid points with 4-km horizontal resolution to cover western Canada from British Columbia and the Yukon to the west and the Mackenzie River Basin (MRB), and the Saskatchewan River Basin (SRB) to the east. In total, the model domain covers 2800 km in the east-west direction and 2560 km in the north-south direction. The model’s vertical coordinate comprised 37 stretched vertical levels topped at 50 hPa in the lower stratosphere. The model simulations employed 20 parameterization schemes, including Thompson microphysics scheme, the Yonsei University (YSU) planetary boundary layer scheme, the Noah land surface model, and the CAM3 radiative transfer scheme. The deep cumulus parameterization was turned off because with a 4-km horizontal resolution the model can explicitly resolve deep convection and simulate convective storms. The convection-permitting model produces precipitation more realistically by directly resolving convections. The 2D and 3D files contain 20 and 13 variables, respectively.
Documentation
The metadata is available from: https://bit.ly/3gYEgSn
References
-
Li, Y., Li, Z., Zhang, Z., Chen, L., Kurkute, S., Scaff, L., and Pan, X. (2019). High-resolution regional climate modeling and projection over western Canada using a weather research forecasting model with a pseudo-global warming approach, Hydrol. Earth Syst. Sci., 23, 4635–4659, https://doi.org/10.5194/hess-23-4635-2019
Data availability
The data is still available upon request.
SCDNA
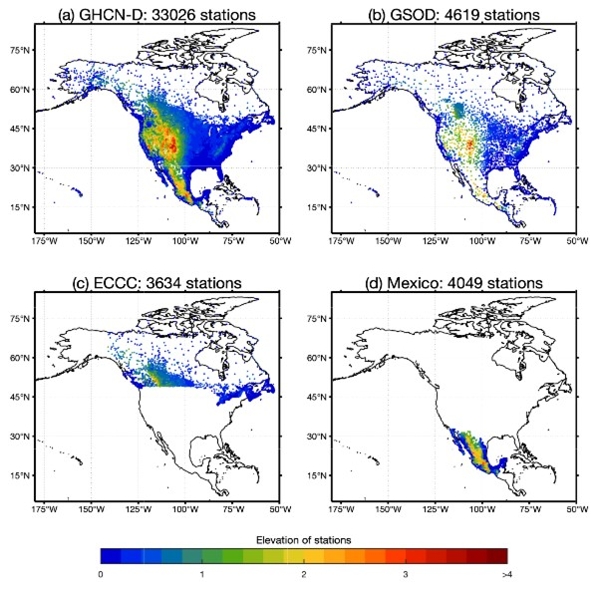
Station-based serially complete datasets (SCDs) of precipitation and temperature observations are important for hydrometeorological studies. Motivated by the lack of serially-complete station observations for North America, a SCD for North America (SCDNA) was developed. The data includes daily precipitation, minimum temperature (Tmin), and maximum temperature (Tmax) data for 27280 stations from 1979 to 2018. Raw meteorological station data were obtained from the Global Historical Climate Network Daily (GHCN-D), the Global Surface Summary of the Day (GSOD), Environment and Climate Change Canada (ECCC), and a compiled station database in Mexico. Stations with at least 8-year records were selected, which underwent location correction and were subjected to strict quality control. Outputs from three reanalysis products (ERA5, JRA-55, and MERRA-2) provided auxiliary information to estimate station records and were also used as an assessment benchmark. Infilling during the observation period and reconstruction beyond the observation period were accomplished by combining estimates from 16 strategies (variants of quantile mapping, spatial interpolation, and machine learning). A sensitivity experiment was conducted by assuming 30 % observations of stations were missing – this enabled independent validation and provided a reference for reconstruction. Quantile mapping and mean-value corrections were applied to the final estimates. The median Kling-Gupta efficiency (KGE) values of the final SCDNA for all stations are 0.90, 0.98, and 0.99 for precipitation, Tmin and Tmax, respectively. The SCDNA is closer to station observations than four benchmark gridded products, and can be used in applications that require either quality-controlled meteorological station observations or reconstructed long-term estimates for analysis and modelling.
Documentation
The metadata is available from: https://bit.ly/3awRsfM
References
-
Tang, G., Clark, M. P., Newman, A. J., Wood, A. W., Papalexiou, S. M., Vionnet, V., and Whitfield, P. H. (2020). SCDNA: a serially complete precipitation and temperature dataset for North America from 1979 to 2018, Earth Syst. Sci. Data, 12, 2381–2409, https://doi.org/10.5194/essd-12-2381-2020.
Data availability
The dataset is available at https://doi.org/10.5281/zenodo.3735533.
WRF CONUS II
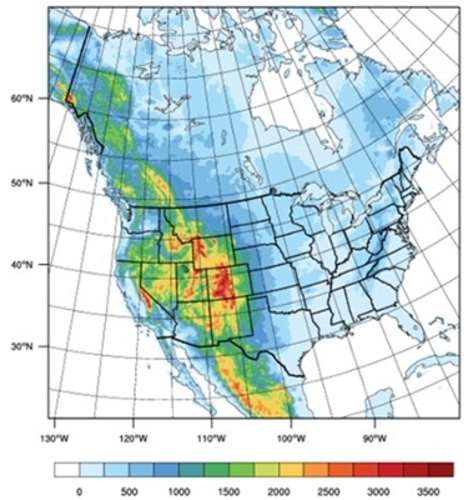
This dataset was produced using a regional climate model (Weather Research and Forecasting, WRF) in a convective permitting scale for most of North America. The simulation resolves the atmospheric processes at 4 km grid spacing and for 21 years in the current climate (from 1995 to 2015). The WRF version 3.9.1. was performed using lateral and boundary conditions from a bias corrected approach, which considers a correction from the ERA Interim reanalysis (average from 1976-2005) over one global climate model; the Community Climate System Model.
Period of simulation: January 1995 - December 2015
Spatial domain: latitude: 15.03; 73.28 longitude: -156.82; -40.31
Vertical levels: 51
Horizontal dimension: 1430 x 1420 grid points
Variables: hourly in 2D and 3D, daily and diurnal monthly products
Data type: gridded atmospheric variables
Data format: NetCDF4 files
Documentation
The metadata will be available soon.
References
-
The data has not yet been published .
Data availability
The data is still in production.
GEM5 Simulations
The Global Environmental Multiscale model version 5.0.0 (GEM5) is used to simulate the months of May and June 2019 over western Canada with a convection-permitting resolution of 0.027° (near 3 km). The GEM5 dynamical core uses a two-time-level quasi-implicit semi-Lagrangian marching scheme, with slight off-centring to reduce the spurious response to orographic forcing. In the horizontal the discretization uses an Arakawa staggered C-grid and in the vertical a hybrid terrain-following hydrostatic-pressure coordinate. However, for the simulations at 3 km the fully elastic non-hydrostatic option was used.
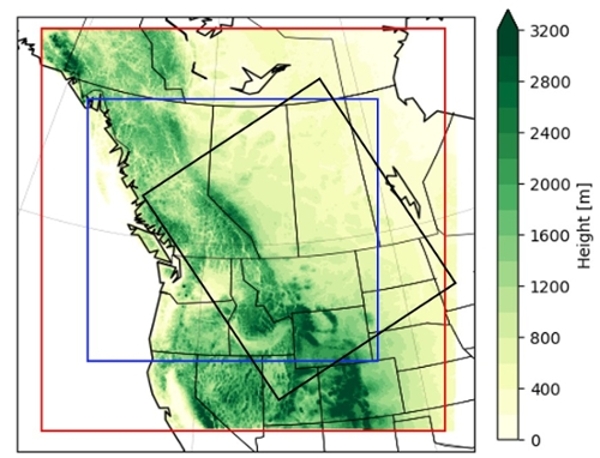
Three simulations with GEM5 were made with different domain sizes over western Canada. The largest domain has 1060 x 1060 horizontal grid points in the free area, covering ~3180 km in both east-west and north-south directions, from British Columbia to the border between Manitoba and Ontario, and from the southern border of Utah to Northwest Territory. The two other domains are smaller and embedded in the next larger one. The driving data used are 1-hourly ERA5 data, provided by ECMWF. The largest and the smallest domains are directly driven by ERA5, whereas the medium sized domain is driven by the 20 minutely output of a larger 12 km GEM5 simulation which in turn was also driven by ERA5.
GEM5 has vertical staggering, top piloting is used in all simulations, and spectral nudging is used for the two larger 3 km domains as well as for the 12 km domain. The period is, for now, from 00 UTC 15 April to 00 UTC 30 June 2019, and the model time step is 60 s. The number of vertical levels is 66 with a top at 25 hPa. For the 3 km simulations the Predicted Particle Properties (P3) bulk microphysics scheme is used to simulate clouds and precipitation fields. The surface scheme can be either ISBA or CLASS, but ISBA is used here. Other parameterizations include the correlated-K terrestrial and solar radiation scheme, the turbulent kinetic energy closure planetary boundary layer and vertical diffusion, the boundary-layer clouds and the shallow-convection clouds. No parameterization is used for deep convection.
The 2D output contains accumulated precipitation types (snow, ice pellets, freezing rain, and rain). The 3D output contains temperature, geopotential height, specific humidity, horizontal wind fields, vertical motion, and number and mass mixing ratios of total ice, rain, clouds, and water vapour. There are also mixing ratios of mass and volume of the riming portion of the total ice for 3D outputs provided by the P3 scheme. Once this configuration fully tested and validated, simulations during multiple years will be conducted. These will be used to assess the evolution of hydrological components, such as the snowpack and the occurrences of the phase of precipitation during different atmospheric conditions.
Documentation
The metadata will be available soon.
References
-
The data has not yet been published .
Data availability
The data is still in production.